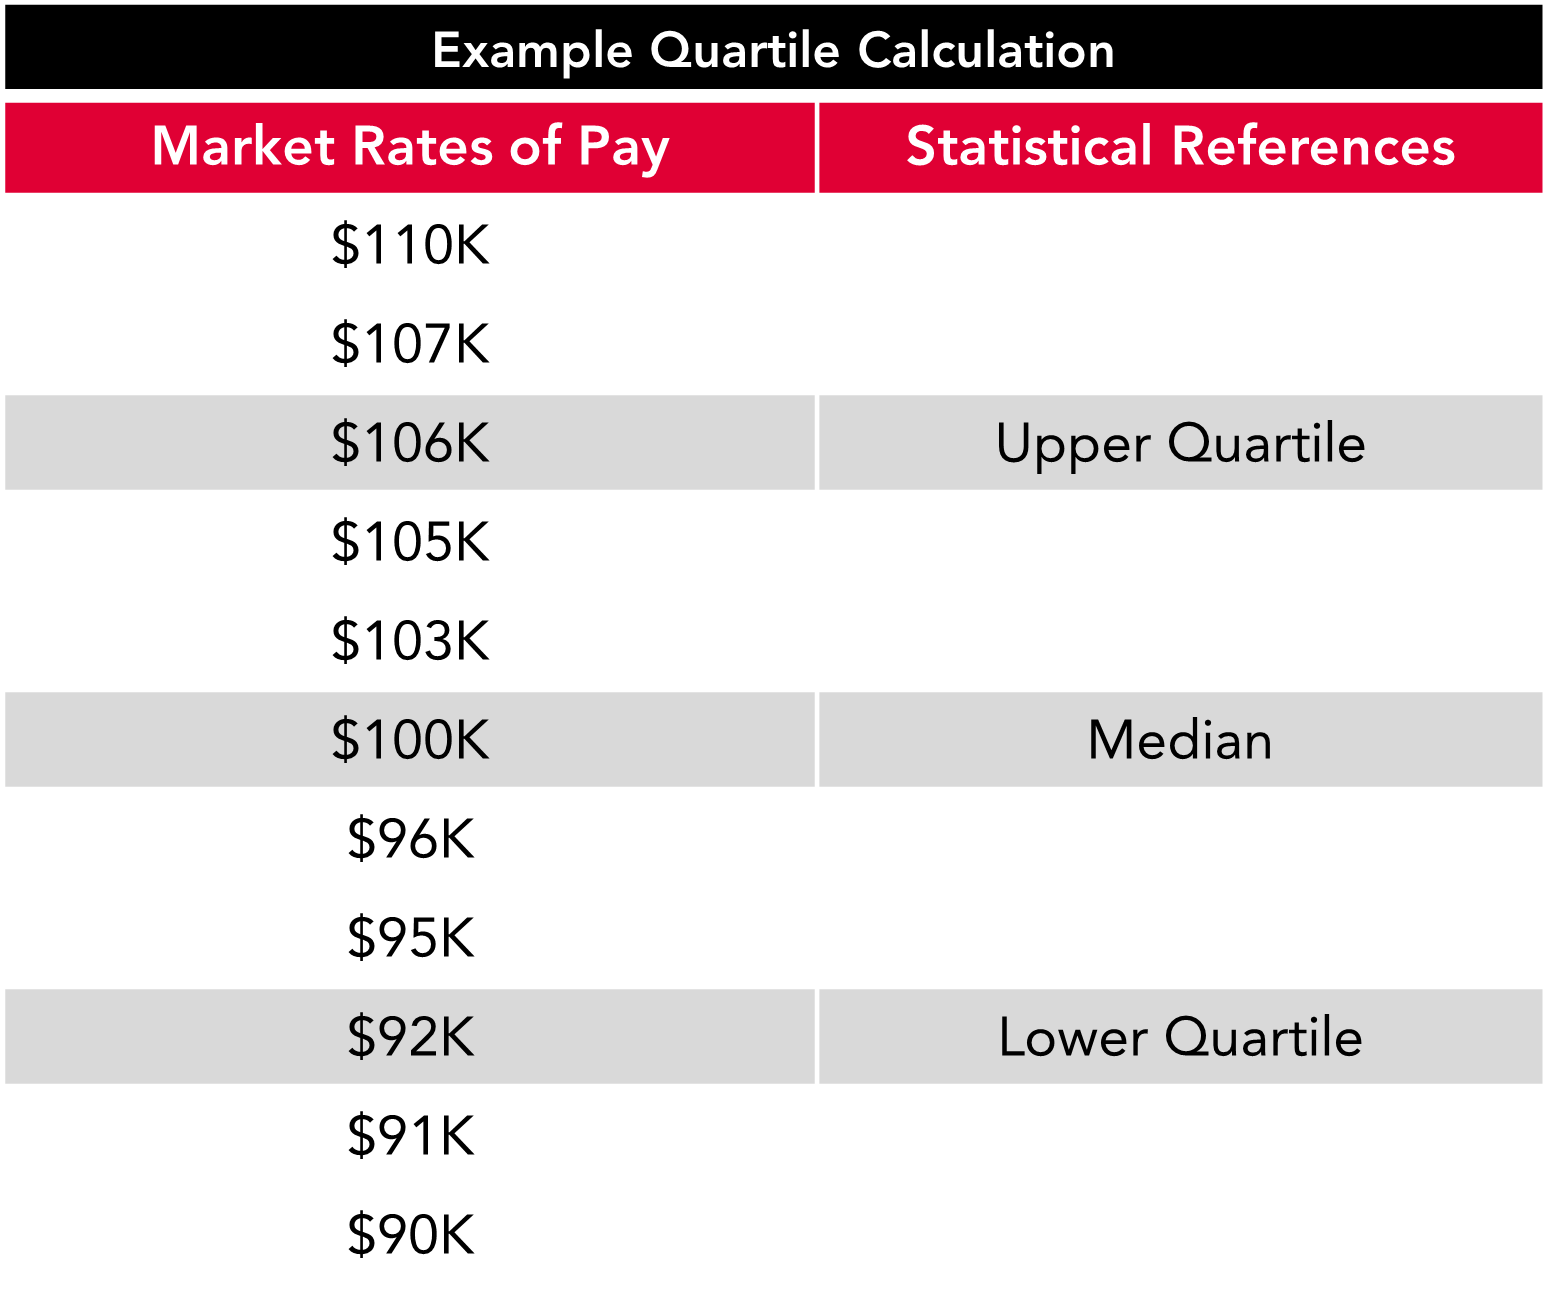
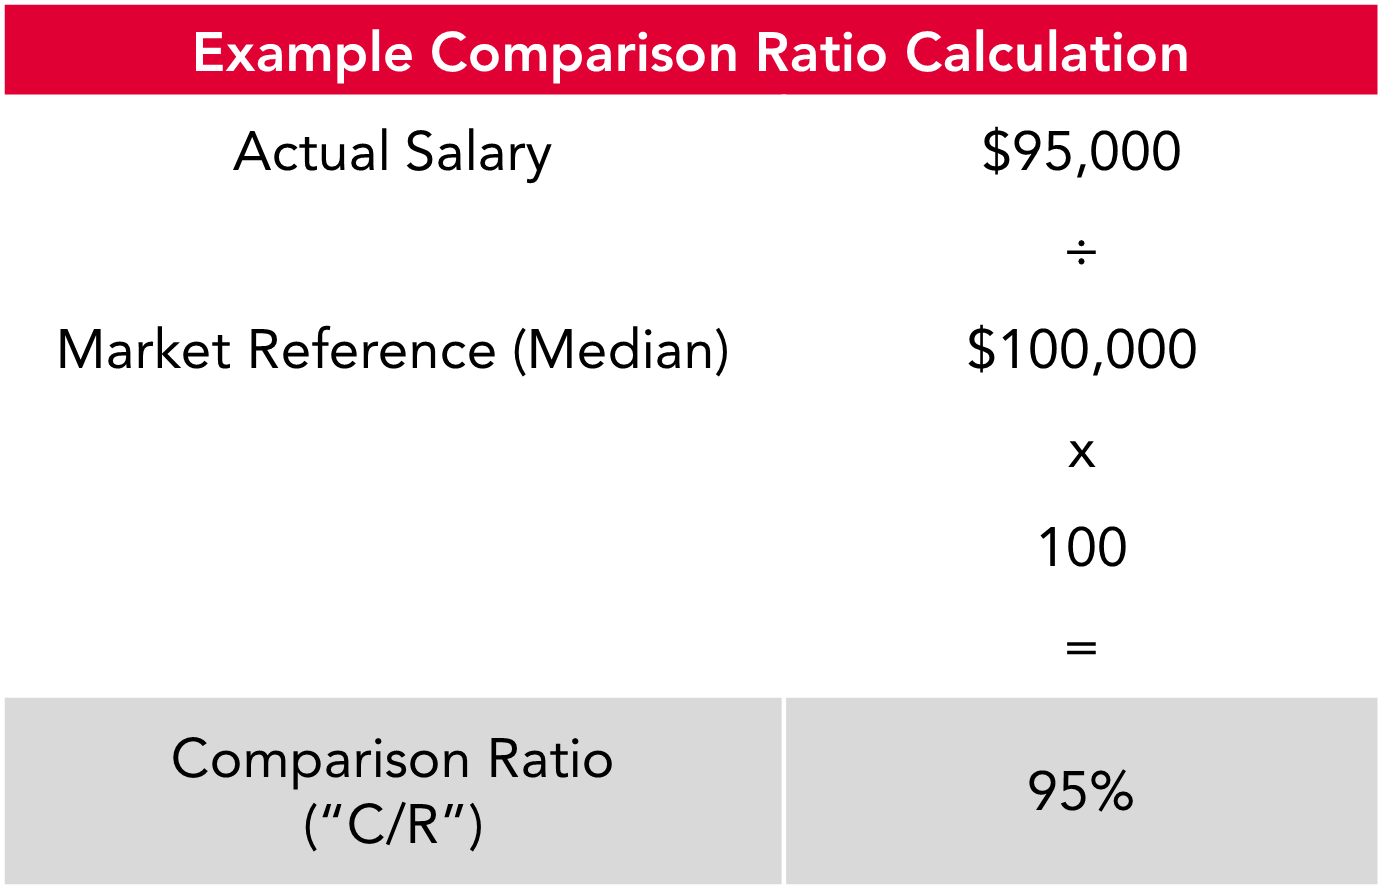
Understanding the terms used by market data and survey providers can be pivotal to getting the most from your data, and to using it to make sound decisions. We’ve set out some of the common terms used along with some example calculations below.
Market Benchmarking Statistics
Market Quartiles
Market data is typically presented based on the statistical aggregation approach referred to as market ‘quartiles’ or ‘percentiles’.
- 25th Percentile / Lower Quartile / Q1 – This means 25% of the market data is paid below the 25th percentile and 75% are paid above. Also known as the lower quartile.
- 50th Percentile / Median / Q2 – This 50% of the sample is paid below the median and 50% are paid above the median.
- 75th Percentile / Upper Quartile / Q3 – This75% of the market data is paid below the 75th percentile and 25% are paid above. Also known as the upper quartile.
Using the quartiles as your reference point can help to avoid issues with extreme outliers in the data set which can skew the figures.
Percentiles are based on the same concept but enable greater granularity – for example, identifying the point halfway between the Median and Upper Quartuiles (which would be the 62.5th Percentile).

Comparison Ratios
A Comparison Ratio calculation is used to compare the salary of an existing employee to the market data and is expressed as a percentage of the market reference point. Similar analysis can be undertaken to compare the salary to a salary range mid-point for example.
In order to understand current positioning, we typically complete comparisons between current salaries and the market at each quartile (Q1, Q2, Q3).

Considering Appropriate Market Positioning
It’s important to keep in mind that market data is really only indicative of appropriate remuneration levels – it does not take into consideration any information regarding individual performance for example Therefore, it may be appropriate to remunerate some roles above your target market position and some roles well below
Rationale for paying above the desired market position may include:
- Incumbent has experience/capabilities beyond standard role requirements
- Role is of critical importance and/or skills in short supply
- Individual is of critical and/or strategic importance to the organisation
Rationale for paying below the desired market position may include:
- Incumbent is new to the role and developing capabilities
- Role is of relatively low value to the organisation
- Abundance of available candidates with relevant skills
In order to acknowledge these potential differences in market positioning, many organisations define an acceptable range in which salaries should fall when compared to notional market positioning (e.g. between 80% and 120% of the target positioning)
