Managing Salary Structures

Developing a salary system for the first time can be a daunting prospect.  Reviewing and replacing an existing system has often proved to be an even more challenging proposition for many of our clients.  Part of the problem, as with many remuneration and reward-related practices, maybe over-complication or the perception that it will somehow be a painful experience.

Having developed dozens of structures for clients over the years we can confidently say that it is not necessary to have an advanced degree in probability theory in order to develop an effective salary structure.  Far more useful would be a clear understanding of what the salary system is intended to achieve in the first place – something that is strangely often overlooked.

Below we’ve shared insight into our approach to designing salary structures from the ground up.  If you’d like to find out more about our suggestions for the ongoing maintenance of an existing salary system you can click here.

Objectives and Design Principles

Clearly, it’s logical to consider the purpose of the salary structure before attempting to design one – though this has often proven to be a difficult challenge for many clients we’ve worked with.   The role of an organisation’s salary system tends to be taken for granted or assumed to be understood without ever really having been tested.  Ask yourself, “What do you think the salary system, and reward offering more broadly, should achieve in an ideal world?”.  Several things may come to mind:

  • Enable consistent salary-related decision making;
  • Support and recognise employee development;
  • Allow for differentiation based on performance;
  • Assist in cost control and pay bill management.

For a greater insight to the best practice principles click below for further reading.


Best Practice Salary System Design

These objectives, along with any others that may be developed,  will likely need to be ranked given the potentially conflicting priorities.  If cost control and consistency are the primary drivers it follows that a structure with less room for discretion and differentiation would be required than if the aim is to support employee development.

For us, salary systems play an important role in supporting the broader organisational design and HR strategy – with that in mind we recommend considering the bigger picture resourcing principles of the organisation, for example:

  • Are we a ‘buy’ or ‘build’ organisation when it comes to talent acquisition?
  • Are we a hierarchical, command-and-control type organisation or a flatter or network-based organisation?

These key principles will help shape the final structure as well as guide the selection of the tools and inputs used to develop it.  Shown below are some of the more common types of salary salary structure that you might start to identify with.

Grade Structure

Grade Structure

  • “Pay the job”
  • Relatively rigid structure;
  • Narrow pay ranges (±10% of mid point);
  • Retains granularity of grading;
  • Accommodates large number of grades/levels;
  • Minimum overlap in pay between grades;
  • ‘Pay ceiling’ easily reached;
  • Limited adaptability to market;
  • Focus on control over salaries.

Broad Bands

Broad Bands

  • “Pay the person”
  • Consolidates a number of grades into broader salary bands;
  • Relatively flexible structure;
  • Broader pay ranges (±20-30% of midpoint);
  • Pay can increase with capabilities;
  • Allows adaptability to market movement;
  • Overlap in ranges paid to each band recognises individual contribution to the organisation over hierarchy;
  • Emphasis on career development;

Market Matching

Market Matching

  • Pay levels rely heavily on market movements;
  • Pay the job & the person;
  • Requires adaptability to market;
  • Pay is determined on a job-by-job basis according to market rates and individual capabilities;
  • Ensures market competitiveness;
  • Works well for companies with smaller employee base;
  • Well suited to companies dealing with experts or ‘knowledge workers’.

Job Evaluation

Now that we have established a clear understanding of the objectives of the salary system we can begin to develop a best-fit structure.  For this phase of the process we’ll focus on three distinct inputs; market data, job sizing and current employee salaries (assuming there are some).

Our first critical input is to access some form of internal job sizing.  Depending on your circumstances it may not be necessary to adopt a full-on approach to job evaluation – simply ranking and grouping the organisation’s roles into instinctive clusters can be sufficient in the first case.

That said, the greater the granularity you can achieve in regard to job sizing the more options you will have when it comes to assessing best-fit options for the structure.

If embarking on a program of formal evaluations or re-evaluations keep in mind this can be a very time-consuming process, as well as often creating controversy and conflict when it comes to achieving sign off on the final outcomes.  Allow plenty of time for this process to avoid disappointment.

Market Benchmarking

In truth, exploring the ins and outs of effective handling of market salary data would need a paper all of its own.  It is important, however, yet perhaps counterintuitive, not to overcomplicate the use of external data in the process.

Selecting data from a robust source, with good coverage of the roles in your organisation and the labour markets that you compete in is as complicated as it needs to be.

There will be a need to allow sufficient time for effective job matching.  We advocate taking a ‘job content’ based approach, where your roles are matched to the generic role descriptions covered by the survey, rather than matching based on job size.  This is helpful for a couple of reasons, most notably that we get a more direct view of the market for specific skills rather than aggregated data that doesn’t relate to any specific role or skill set.

Building regression lines based on job sizing may be interesting if you’re a statistician, but is unlikely to be effective in practice – market data is simply not robust enough for that kind of analysis once you really scratch the surface of it.

A best-fit structure will be one that achieves the best balance between aligning with market forces and providing a reasonable and structured progression between the ‘natural’ levels of the organisation.   The design process can be made much more intuitive for everyone involved if we take a visual approach as I’ll explain below.

Boxes and Dots

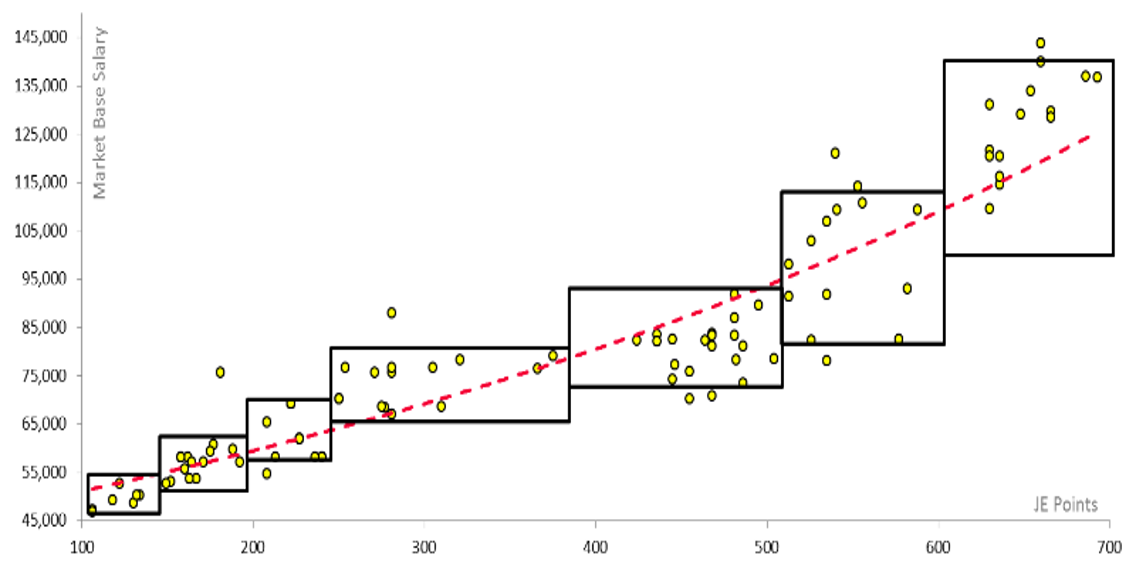
And now for the fun bit!  Life is always more fun in pictures and developing effective salary structures is no different.  As I mentioned earlier, park the regression analysis and simply plot your inputs to enable a visual approach to this phase of the design.  We’ve come to affectionately refer to the process as drawing ‘Boxes and Dots’.

In the chart above, each yellow dot represents a role, showing its market salary/job sizing cross-reference.  The boxes represent potential grades/bands based on clusters that would seem to offer a natural fit.

There may well be several plausible alternatives and this is where our design principles kick in.  Are we aiming for a larger number of narrower ranges, or fewer, broader bands?

We can also apply some more general principles here as we search for an optimum structure to take forward.  For example, we might agree that it is appropriate for the clusters to cover a broader spread of job sizes as the roles in question grow in seniority and responsibility.  Similarly, we will likely be comfortable with wider salary ranges from top to bottom to align with these broad bands.

Through trial and error, and visualisation, we can work to identify a notional structure that can be further stress tested.  We’ve not become bogged down in the absolute numbers at this stage but narrowed our focus on something that might actually work in practice.

Finessing and Testing

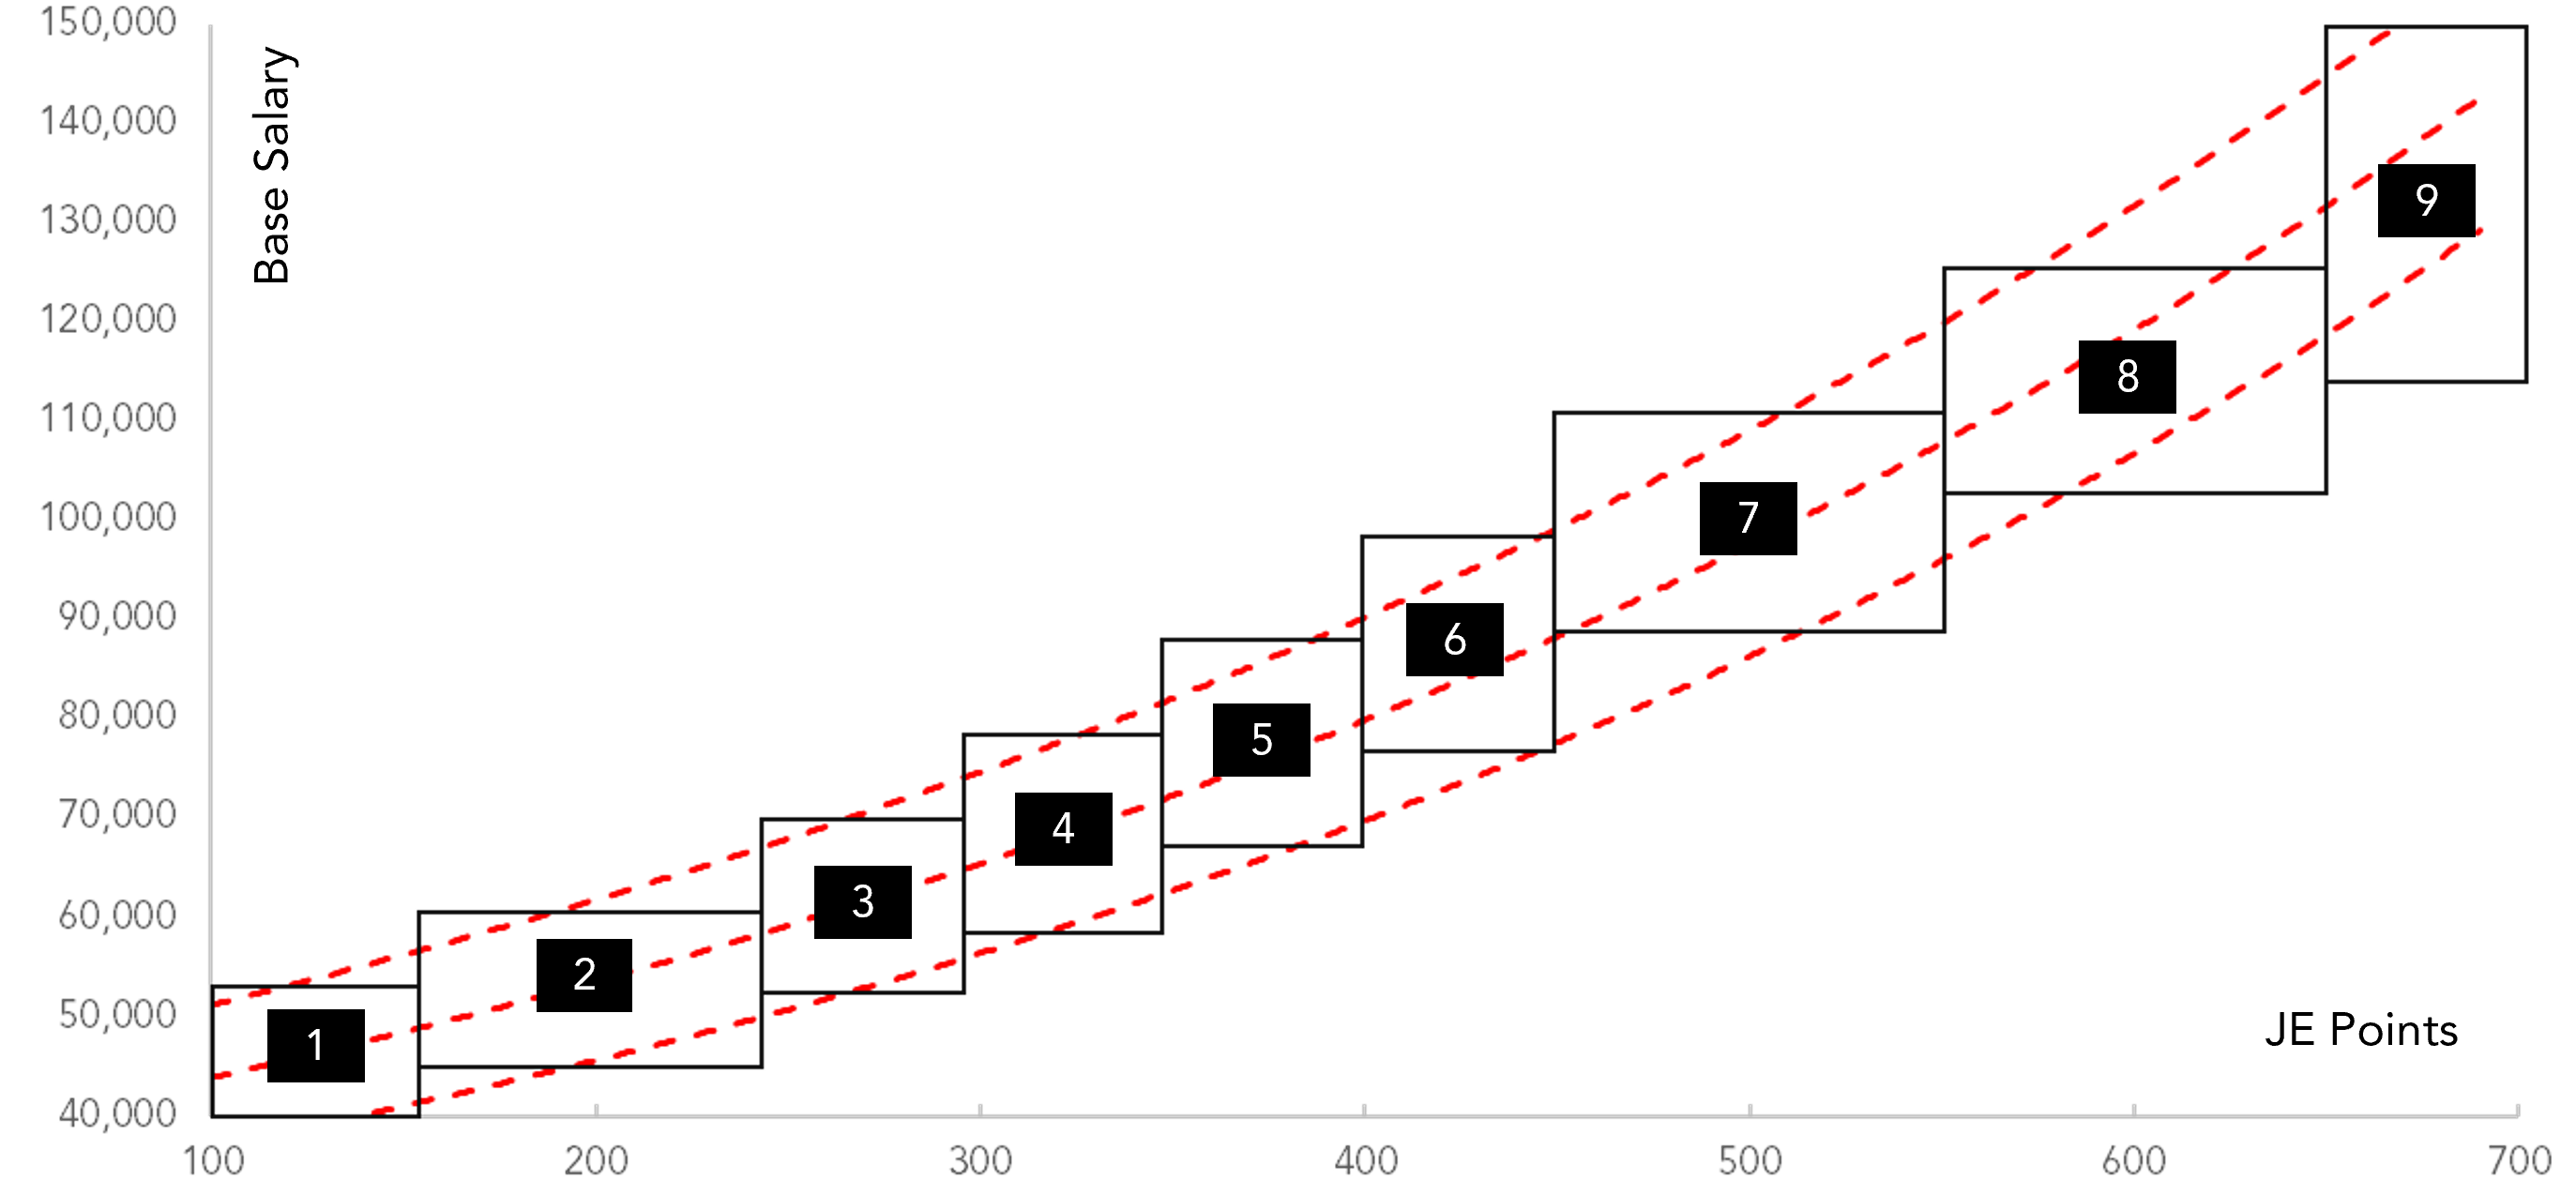
In this chart, the red lines now represent the lower, median and upper quartiles of the aggregated market data for all roles assigned to the notional structure we landed on using the boxes and dots method.

From this perspective, we can begin to test whether the spread of market rates for each role assigned to a notional grade/band appears to offer a general progression as the roles grow in size.

Similarly, do some of the reference points look out of kilter with others?  If so, we can test both the benchmarking and job evaluations to make sure we’re comfortable or to identify a case for amending one or both sides of the equation.

By utilising a similar graphing process we can go on to plot the proposed salary range minima/maxima to explore how well the market data is encapsulated and begin to tweak the proposed ranges to arrive at the best fit.

Further Development

Depending on the shape, size and operations of your organisation it may well be necessary to extend the analysis to consider whether a better fit can be achieved based on things like geographic splits or separating your roles into distinct groups (like technical professional roles versus semi-skilled or general operational roles).

Regardless of the breadth of coverage, the process remains the same.  Map the dots (market salary/job sizing), look for the best-fit clusters and test the required spread.

Other checks and balances can also be applied at this stage, such as ensuring the structure meets Award mandates for example.  Again, we can adjust the design to accommodate these obligations if it has not happened naturally.

Transition Analysis

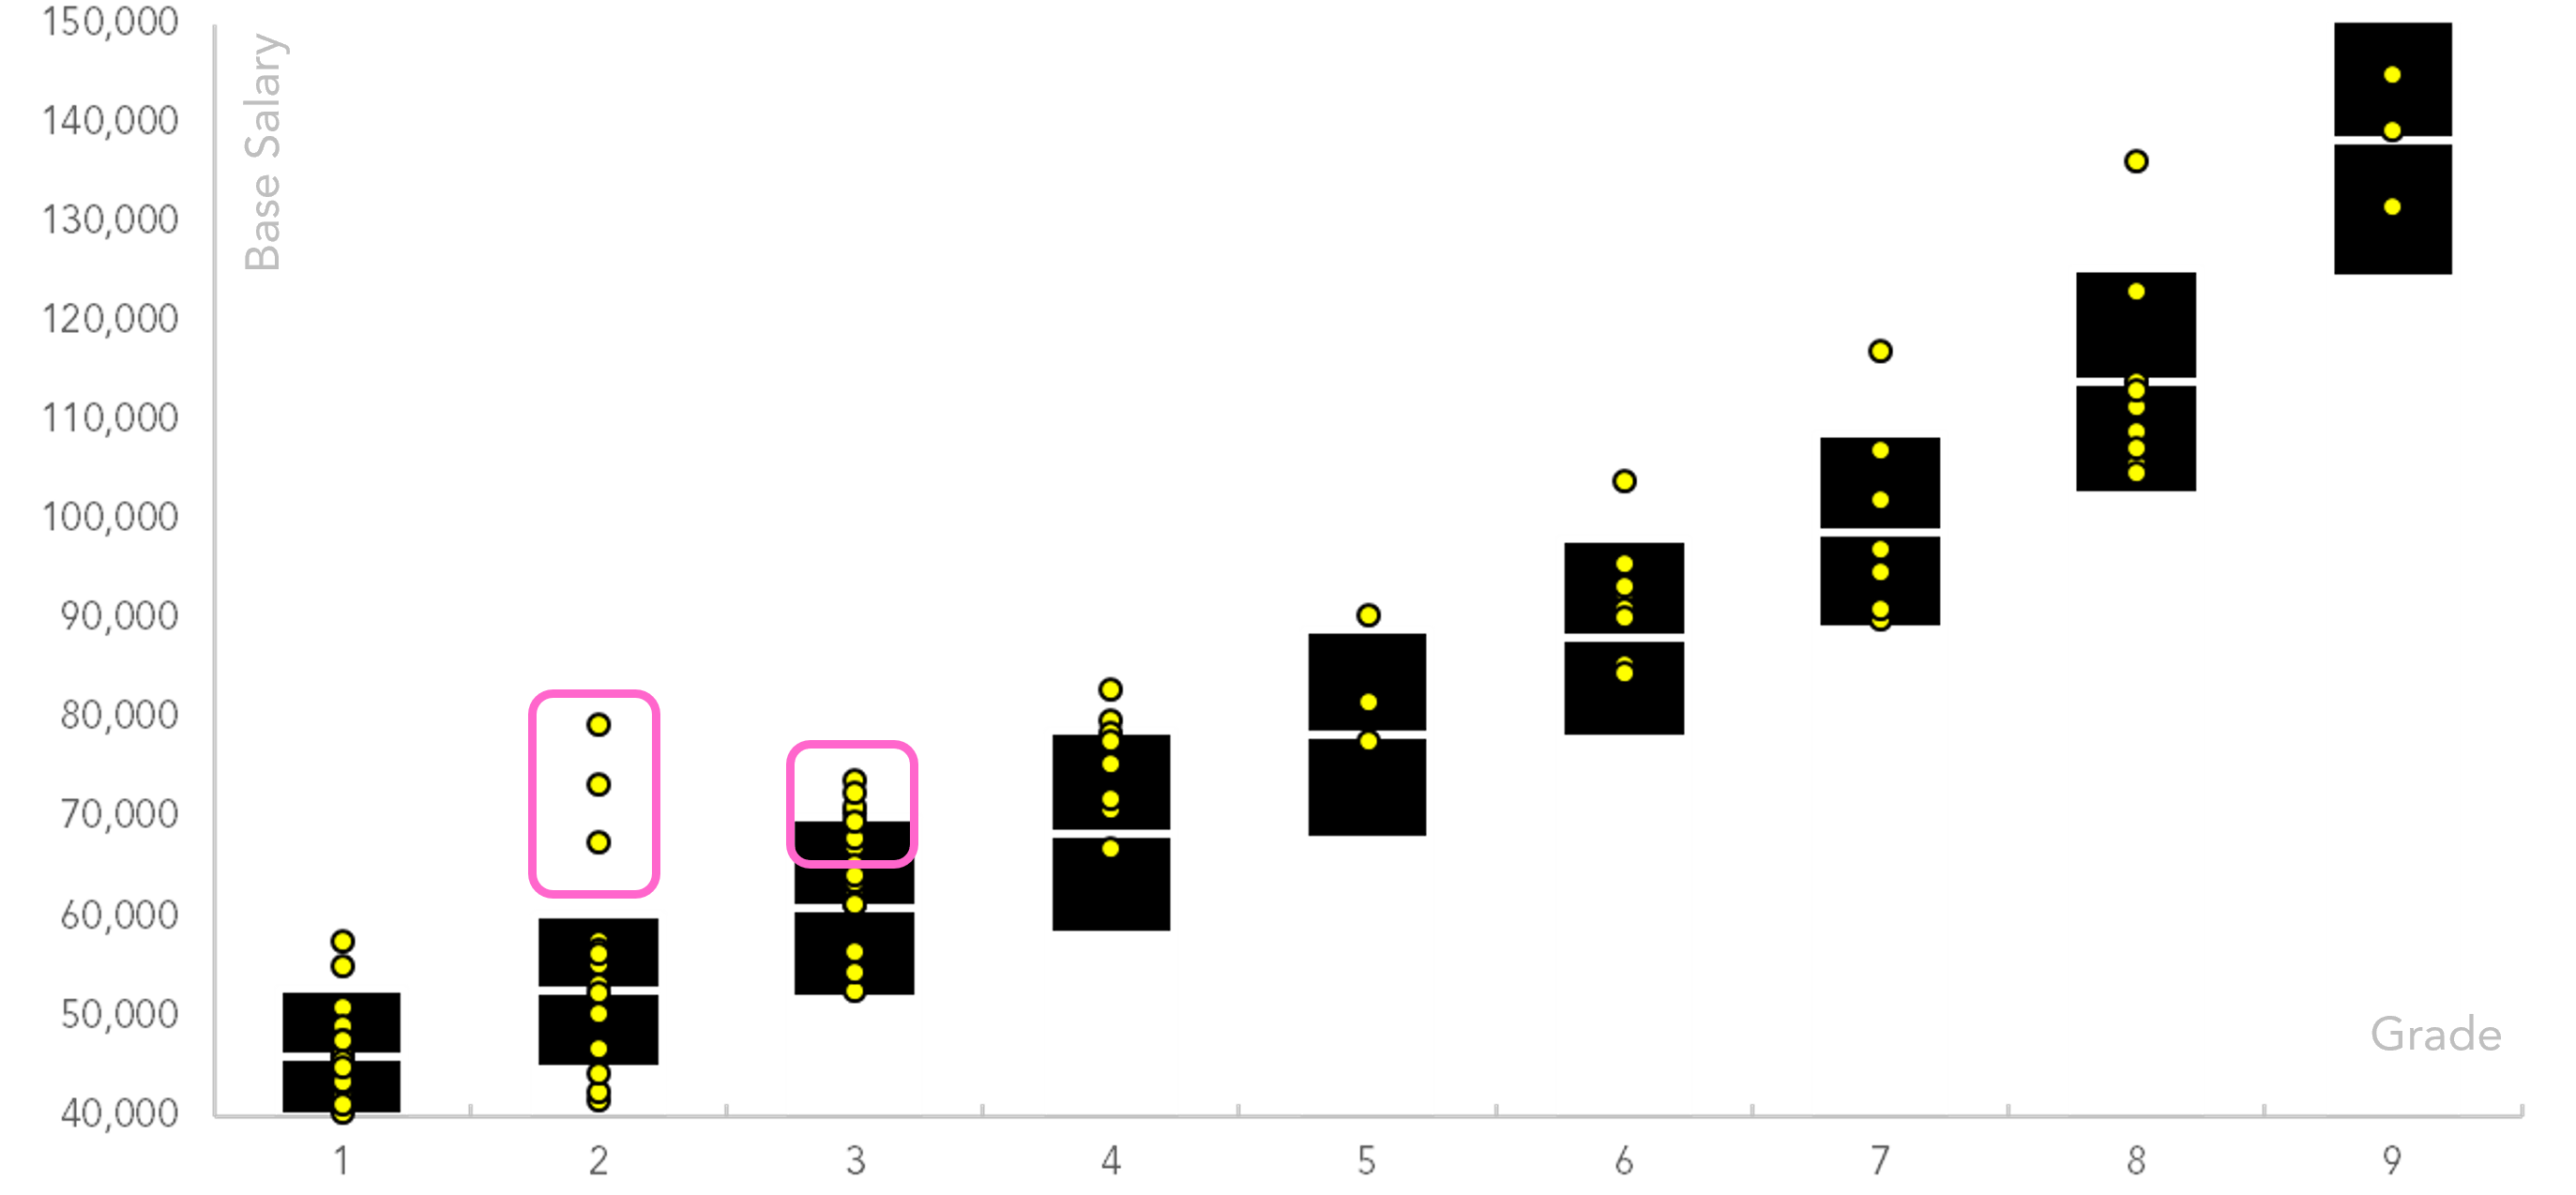
A final phase of the design process focuses on the transition challenge.  At this stage you will want to introduce actual employee salaries to your boxes and dots graphs to immediately assess the scale of the potential change.  How many dots (now incumbent salaries as opposed to market rates) sit outside the proposed new structure?

  • Too many below the new salary range ‘boxes’ and the cost of implementation may become prohibitive as salaries would need to be increased to facilitate implementation.
  • Too many above, and the structure may create undesired pressure to freeze salaries for the best performers.

At this stage you may find it is possible to once again tweak the proposed structure and/or salary ranges to provide a better fit with current practices.  The visual representation can also provide a great basis for reviewing outliers – by drilling down from the graph it often becomes clear that there are accepted reasons why an anomaly exists, meaning that the organisation may be happy to live with a small number of individuals sitting outside the structure when it is implemented.

If not considered already, it will be necessary at this point to put a finer point on the proposed structure.  For example, setting out the specific salary ranges, confirming the overlaps and progression between the grades gives us our final structure.

Capability Needs and Integration

To come full circle back to our design principles and objectives we can now start to consider to what degree other processes/systems integrate with the salary system.  For example, if salary progression is to be linked to professional development do we have sufficient tools, systems and frameworks in place to provide the inputs we need to salary decisions?

Knowing where to start when managing salary structures can be difficult – we’re here to help.

Contact Us